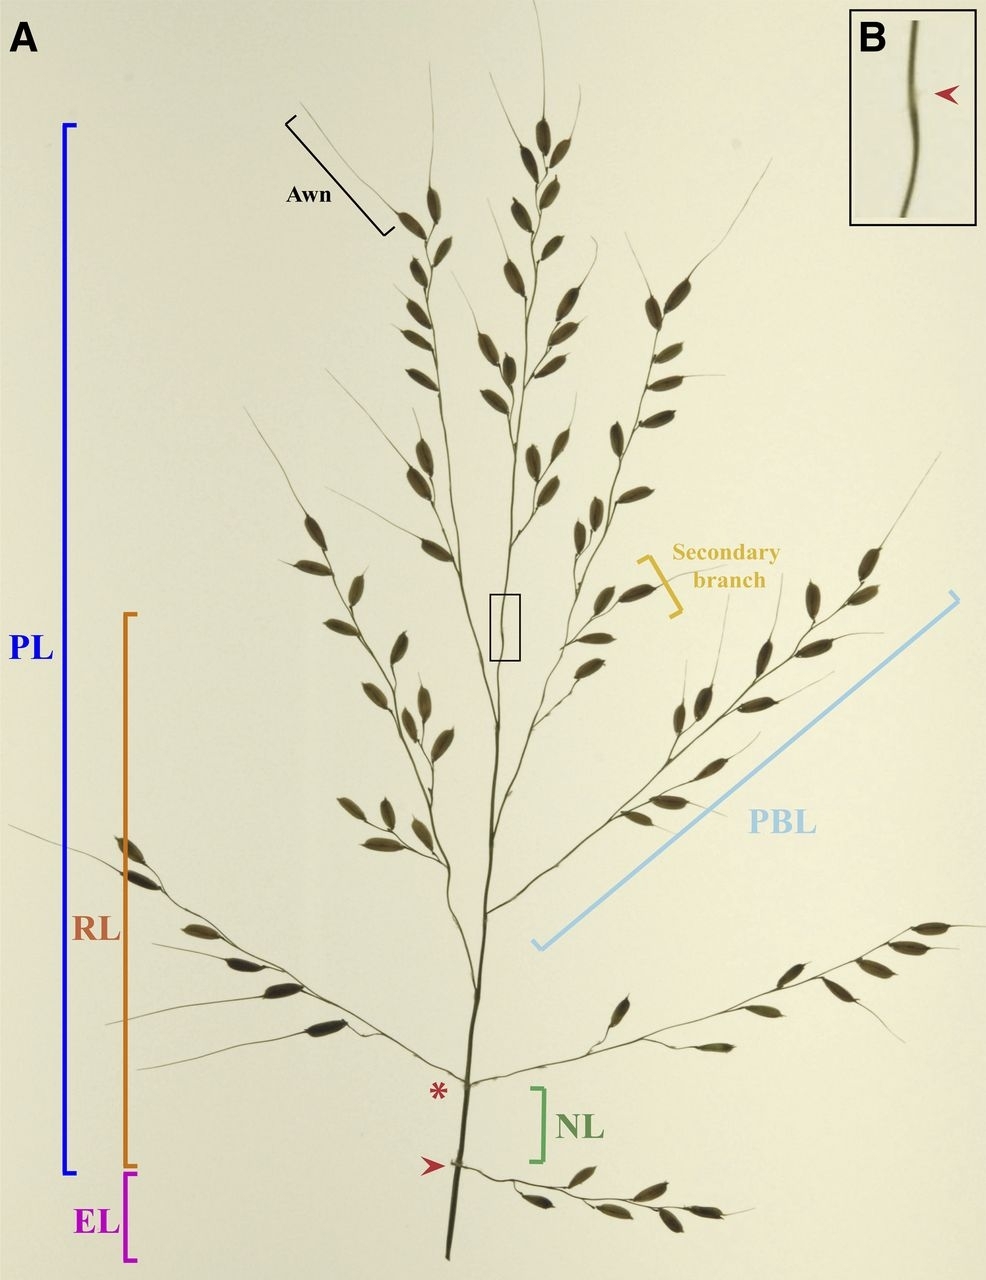

Researchers have developed a system that measures inflorescence traits in rice subpopulations as an aid to breed plants with higher quality and yield (image: rice inflorescence architecture / American Society of Plant Biologists)
Researchers have developed a system that measures inflorescence traits in rice subpopulations as an aid to breed plants with higher quality and yield.
Researchers have developed a system that measures inflorescence traits in rice subpopulations as an aid to breed plants with higher quality and yield.

Researchers have developed a system that measures inflorescence traits in rice subpopulations as an aid to breed plants with higher quality and yield (image: rice inflorescence architecture / American Society of Plant Biologists)
By Elton Alisson | Agência FAPESP – Rice panicles, the inflorescences at the top of the plant that produce grains when pollinated, are considered a key breeding target because of their association with quality and yield.
However, selection of varieties based on the morphological traits (phenotypes) of this part of the rice plant is difficult. This is mainly because of the diversity among the rice subpopulations that have originated from breeding programs in recent decades, which has resulted in different flowering structures.
For this reason, according to agronomists and specialists in the field, manual analysis and measurement of rice panicle phenotypes from various subpopulations is impossible for breeders interested in identifying plants with the best and largest inflorescences.
Alexandre Xavier Falcão, a researcher at the University of Campinas’s Computer Science Institute (IC-UNICAMP) in São Paulo State, Brazil, in collaboration with colleagues in the Plant Breeding & Genetics Section of Cornell University’s School of Integrative Plant Science in the United States, set out to overcome this barrier by developing an open-source software system for analyzing and measuring the phenotypes of rice and other crops.
Resulting from a project conducted with a research scholarship abroad from FAPESP, the PANorama panicle phenotyping platform enabled the research group, who also used other statistical tools, to identify genes that could be used to improve rice panicle development.
Some of the group’s findings are described in an article published by the journal Nature Communications in February 2016.
“The software is capable of measuring a range of different phenotypes of rice and other grass panicles, which could not be measured manually in an automatic and simultaneous manner,” Falcão told Agência FAPESP. “These phenotypes can be used in genetic mapping studies to identify the genes possibly responsible with the aim of expressing them in plants.”
The researchers measured 49 panicle phenotypes in 242 samples of Asian rice (Oryza sativa) of the indica, aus, tropical japonica, temperate japonica and aromatic/Group V subpopulations grown under field conditions in the Philippines. They also collected 11 vegetative- and reproductive-stage phenotypes, including a measurement of flowering time. The researchers then performed a genome-wide association study (GWAS) on these 49 phenotypes, extracted from over 3,400 images of rice panicles, and other data to identify genes associated with certain phenotypes based on genomic variables common to different plant varieties.
The study identified ten rice genes that could be associated with yield. “The goal was to identify genes or genomic components that may be associated with the rice subpopulation phenotypes measured by the software, such as height, primary branch length, rachis internode elongation, and average thickness of the panicle-bearing culm,” Falcão said. “By identifying these genes or components, you can, for example, control panicle length to increase rice yield.”
To analyze and measure the rice panicle phenotypes, the researchers planted, collected and preserved 242 samples of Asian rice grown in the Philippines and transported them to the US without breaking stems or losing seeds.
On arrival at Cornell University, the plants were placed under a camera, and the panicles were imaged. The PANorama software platform, described in an article published in the journal Plant Physiology, was used to analyze the 49 phenotypes extracted from the images.
Following image capture, the software computed the panicle’s skeleton, a straight-line representation of its morphological structure. “From the panicle skeleton, for example, the high-resolution software extracts the measurements of the main axes and primary branches,” Falcão explained.
The platform can be used to measure phenotypes of other grasses as well as rice, he added. In the case of rice panicles, one of the group’s ideas is to extend application of the software to measuring the seed area and diameter.
“The software makes possible large-scale plant biology studies by measuring several plant phenotypes with precision,” Falcão said.
The article “Genome-wide association and high-resolution phenotyping link Oryza sativa panicle traits to numerous trait-specific QTL clusters” (doi: 10.1038/ncomms10527) by Falcão et al., published in Nature Communications, can be read at www.nature.com/ncomms/2016/160204/ncomms10527/pdf/ncomms10527.pdf.
The article published in Plant Physiology, “High-resolution inflorescence phenotyping using a novel image-analysis pipeline, PANorama” (doi:10.1104/pp.114.238626), also by Falcão et al., can be read at www.plantphysiol.org/content/165/2/479.full.
Republish
The Agency FAPESP licenses news via Creative Commons (CC-BY-NC-ND) so that they can be republished free of charge and in a simple way by other digital or printed vehicles. Agência FAPESP must be credited as the source of the content being republished and the name of the reporter (if any) must be attributed. Using the HMTL button below allows compliance with these rules, detailed in Digital Republishing Policy FAPESP.


