


Brazilian researchers create computer tools that help to improve agrometeorological models
Brazilian researchers create computer tools that help to improve agrometeorological models.
Brazilian researchers create computer tools that help to improve agrometeorological models.
Brazilian researchers create computer tools that help to improve agrometeorological models
By Noêmia Lopes
Agência FAPESP – Predicting climatic events far in advance and with precision permits direct improvements in agricultural production. However, this forecasting depends on the analysis of enormous volumes of data collected by satellite, radars and sensors. Although technological advances have been made, the quantity and complexity of information remain challenges to meteorologists and agrometeorologists.
To perfect the available tools, researchers from the Department of Computer Sciences at the Universidade de São Paulo’s Mathematical and Computation Institute (ICMC/USP-São Carlos) began the AgroDataMine project to develop data mining methods and techniques to support research in climate change, with an emphasis on agrometeorology and support from the Microsoft-FAPESP Information Technology Research Institute.
Since then, the team has been integrating complex and heterogeneous data—such as satellite images, temporal series of meteorological indices and climate models—measured in terabytes (trillions of bytes).
“We utilized and developed innovative technology and mathematical algorithms to find correlations between data, indicating the ways of identifying extreme events such as large volumes of rainfall,” explained Agma Juci Machado Traina, a professor at ICMC/USP and the coordinator of research at Agência FAPESP.
Three new computer tools are in operation. The SatImagExplorer software extracts temporal series of meteorological indices based on satellite images and conducts grouping analyses and classifications. This allows scientists to evaluate the data for a given region over a defined period of time.
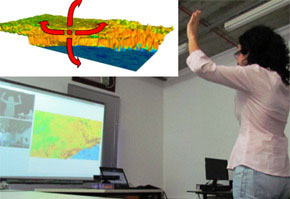
Another program, the ClimFractal Analyzer, identifies correlations based on climate models or real data. The TerrainViewer is a tool that allows scientists to visualize satellite images in three dimensions.
The programs are available to ICMC/USP researchers and partners involved in AgroDataMine: Embrapa Informática Agropecuária (a unit of the Brazilian Agricultural Research Corporation), the Center for Applied Meteorological and Climatic Research for Agriculture at the Universidade Estadual de Campinas (Cepagri/Unicamp), the Computation Department at the Universidade Federal de São Carlos (UFSCar), the Universidade Federal do ABC (UFABC), Carnegie Mellon University (CMU, in the U.S.), and ICMC/USP’s Group of Databases and Images.
“The partners contributed to the development techniques, the orientation of students, validation of results and provision of data collected by satellites, radars and surface sensors,” said Traina.
Data mining
The main challenge was the selection of relevant information from a very heterogeneous and voluminous data set. “We focused on the State of São Paulo, working with regions that are small or large sugarcane producers, and sought correlations between production rates and real and simulated climatic indices,” said Traina.
The first step taken by Embrapa was georeferencing of satellite images—organized and superimposed in such a manner that they present the same geographic positions. With this accomplished, the team began to form the basis of images and data.
The second step involved counterpositioning the remote sensing information (obtained via satellite) and surface sensing (using Cepagri/Unicamp’s sensors for measurements of weather characteristics such as precipitation and temperature).
Based on this counterpositioning, the so-called temporal series began to take shape, organized in the third and last stage of the study. “We did separations between the series working with correlation algorithms, seeking standards and association rules,” said Traina.
To this end, the researchers turned to data mining (a set of methods and techniques used to explore information to search for regularities that cannot be directly extracted).
“According to what we mined, we corroborated a series of suspicions that the specialists had not managed to prove. One of them is the tendency of a given year to be atypical, with phenomena such as La Niña or El Niño—until then identified only after the fact,” added Traina.
Another important approach was the use of fractal theory, made famous by the French mathematician Benoît Mandelbrot in the 1970s. It is an area of mathematics that measures and classifies complex situations not based on traditional geometry and involves studying the properties and behavior of fractals (auto-similar objects regardless of scale).
In AgroDataMine’s work, fractal theory supported mapping data distributions, the identification of standards and temporal exceptions and monitoring of multiple series, such as those that involve simultaneous measurements of rainfall and minimum and maximum temperatures.
“In this manner, we identified, for example, how events such as La Niña and El Niño influence extreme rain, which can contribute to agricultural monitoring of the main crops in São Paulo—sugarcane and coffee,” explained Traina.
Information visualization
Information visualization, a branch of computer science, also provided analysis techniques used in the project. Information visualization techniques aid in the analysis and comprehension of data by utilizing, as the name implies, visual representations.
One of AgroDataMine’s ideas was to utilize Microsoft’s Kinect platform. “We were seeking a simple and natural interaction among users—who are not computer specialists—with the systems developed. Without the need for devices such as a mouse, Kinect allows users to navigate through high-resolution satellite images projected on large screens using only hand movements,” commented Traina.
In addition to the 19 computer scientists, other professionals involved in the project included agricultural engineers, agronomical engineers and cartographers.
The origin of these efforts was a doctoral dissertation titled “Integrating time series mining and fractals to discover patterns and extreme events in climate and remote sensing databases,” presented in 2010 by Luciana Alvim Santos Romani, then under the supervision of professor Agma Traina at ICMC/USP.
To date, AgroDataMine has generated 18 publications and presentations in national and international conferences. The project has also trained new human resources for the area, with two scientific interns, three master’s students and three doctoral students, all with FAPESP fellowships.
“The same team intends to continue the study and research on the subject,” stated Traina. For now, the computer tool will be used in academic circles. In the future, if the tool is integrated into more robust systems through partnerships with companies, the commercialization of the programs has the potential to result in more rapid and precise forecasts, better preparation for extreme weather events and greater probabilities of minimizing the effects of such events on agricultural production.
The Agency FAPESP licenses news via Creative Commons (CC-BY-NC-ND) so that they can be republished free of charge and in a simple way by other digital or printed vehicles. Agência FAPESP must be credited as the source of the content being republished and the name of the reporter (if any) must be attributed. Using the HMTL button below allows compliance with these rules, detailed in Digital Republishing Policy FAPESP.
