


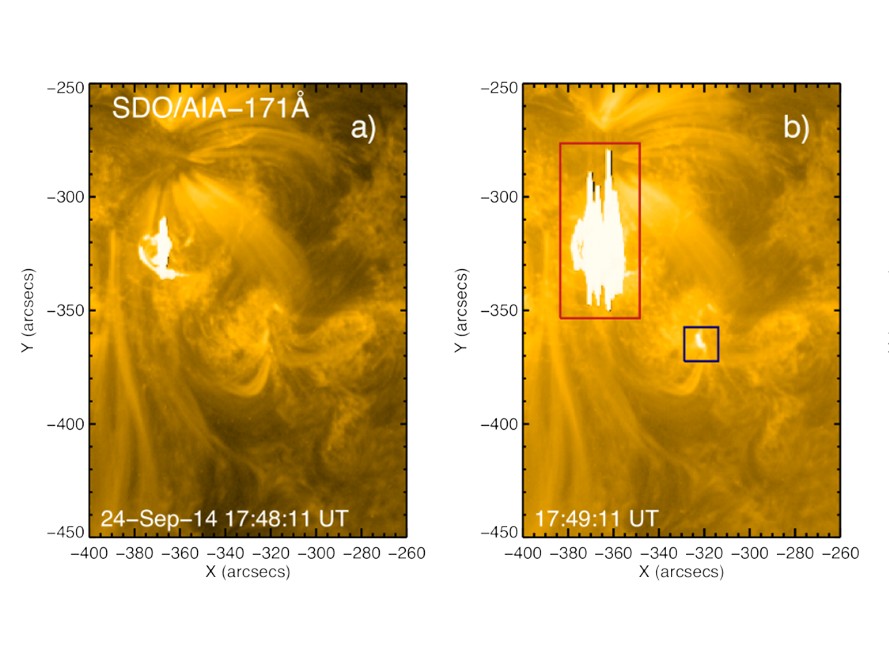
Temporal evolution of solar flare observed on September 24, 2014: (a) (left) only one of the bright spots appears; (b) (right) the second spot starts to appear. These regions do not mark the footpoints analyzed in the study (credit: Simões et al., 2024/Solar Dynamics Observatory)
Computer simulations based on the standard model did not account for observational data obtained via telescope, showing that other factors must be taken into consideration when analyzing the process.
Computer simulations based on the standard model did not account for observational data obtained via telescope, showing that other factors must be taken into consideration when analyzing the process.
Temporal evolution of solar flare observed on September 24, 2014: (a) (left) only one of the bright spots appears; (b) (right) the second spot starts to appear. These regions do not mark the footpoints analyzed in the study (credit: Simões et al., 2024/Solar Dynamics Observatory)
By José Tadeu Arantes | Agência FAPESP – Solar flares are extremely intense events that occur in the Sun’s atmosphere, lasting anywhere from a few minutes to several hours. According to the standard flare model, the energy that triggers these explosions is transported by accelerated electrons that hurtle from the magnetic reconnection region in the corona to the chromosphere. As the electrons collide with the chromospheric plasma, they deposit their energy in the plasma, which is heated and ionized as a result. They also cause intense radiation in several bands of the electromagnetic spectrum. The regions in which energy is deposited are termed solar flare “footpoints”, which normally appear in magnetically connected pairs.
A recent study set out to test the validity of the standard model by comparing results of computer simulations based on the model with observational data provided by the McMath-Pierce telescope during the solar flare SOL2014-09-24T17:50. The study focused on measuring time lags between infrared emissions from two paired chromospheric sources in the flare. An article on the study is published in the journal Monthly Notices of the Royal Astronomical Society.
“We found a significant difference between the observational data from the telescope and the behavior predicted by the model. In the observational data, the paired footpoints appeared as two very bright regions of the chromosphere. Because the incident electrons exited the same region of the corona and followed similar trajectories, the two spots should have brightened almost simultaneously in the chromosphere according to the model, but the observational data showed a delay of 0.75 seconds between them,” said Paulo José de Aguiar Simões, first author of the article and a professor affiliated with the Radio Astronomy and Astrophysics Center (CRAAM) at Mackenzie Presbyterian University’s Engineering School (EE-UPM) in São Paulo, Brazil.
A lag of 0.75 sec may seem irrelevant, but the researchers calculated that the maximum delay according to the model should be 0.42 sec considering all possible geometric configurations. The actual number was almost 80% higher. “We used a sophisticated statistical technique to infer the time lags between footpoint pairs, and estimated uncertainties for these values by the Monte Carlo method. Furthermore, the results were tested by electron transport simulations and radiative-hydrodynamic simulations. By deploying all these resources, we were able to construct different scenarios for the electrons’ time of flight between the corona and the chromosphere and the infrared radiation production time. All scenarios based on the simulations displayed far smaller time lags than the observational data,” Simões said.
One of the scenarios tested was for spiraling and magnetic trapping of electrons in the corona. “Using electron transport simulations, we explored scenarios that involved magnetic asymmetry between flare footpoints. We expected the electron chromosphere penetration time lag to be proportional to the difference in magnetic field intensity between footpoints, which would also increase the difference in the number of electrons reaching the chromosphere owing to the magnetic trapping effect. However, our analysis of X-ray observational data showed footpoint intensities to be very similar, pointing to similar amounts of electrons deposited in these regions and ruling this out as the cause of the observed emission time lags,” he said.
The radiative-hydrodynamic simulations also showed that ionization and recombination timescales in the chromosphere were too short to explain the lags. “We simulated the infrared emission timescale. We calculated electron transport to the chromosphere, electron energy deposition, and its effects on the plasma: heating; expansion; ionization and recombination of hydrogen and helium atoms; and radiation produced at the site, which has the effect of releasing excess energy. Infrared radiation is produced as a result of the increase in electron density in the chromosphere due to ionization of hydrogen, which is originally in a neutral state in the plasma. The simulations showed that ionization and infrared emissions occur almost instantly owing to penetration by the accelerated electrons, and therefore can’t explain the lag of 0.75 sec between footpoint emissions,” Simões said.
In sum, none of the processes simulated in accordance with the model proved capable of explaining the observational data. The conclusion drawn by the researchers was obvious to some extent: the standard model of solar flares needs to be reformulated, as required by the scientific method.
“The time lag observed between chromospheric sources challenges the standard model of energy transport by electron beam. The longer delay suggests other energy transport mechanisms may be involved. Mechanisms such as magnetosonic waves or conductive transport, among others, may be necessary to account for the observed delay. These additional mechanisms should be taken into consideration to achieve a full understanding of solar flares,” Simões said.
FAPESP supported the study via two projects (13/24155-3 and 22/15700-7).
The article “Precise timing of solar flare footpoint sources from mid-infrared observations” is at: academic.oup.com/mnras/article/532/1/705/7699879?utm_source=advanceaccess&utm_campaign=mnras&utm_medium=email.
The Agency FAPESP licenses news via Creative Commons (CC-BY-NC-ND) so that they can be republished free of charge and in a simple way by other digital or printed vehicles. Agência FAPESP must be credited as the source of the content being republished and the name of the reporter (if any) must be attributed. Using the HMTL button below allows compliance with these rules, detailed in Digital Republishing Policy FAPESP.
