


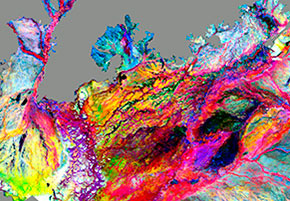
Computer-processed imaging of the Pantanal was conducted as part of a study at the Geosciences Institute, which is seeking to define the internal sub-divisions of the biome (image: IGc/USP)
The objective of this study conducted at the Geosciences Institute was to determine the boundaries of the Pantanal biome and precisely define its sub-divisions.
The objective of this study conducted at the Geosciences Institute was to determine the boundaries of the Pantanal biome and precisely define its sub-divisions.
Computer-processed imaging of the Pantanal was conducted as part of a study at the Geosciences Institute, which is seeking to define the internal sub-divisions of the biome (image: IGc/USP)
By Fabio Reynol
Agência FAPESP – The Pantanal, the world’s largest floodplain, is one of the most complex biomes in terms of establishing its boundaries and defining its internal subdivisions. The compilation of data and the development of criteria for mapping the Pantanal biome were some of the challenges encountered in a research project led by the Geosciences Institute of the University of São Paulo (IGc/USP), which studied a nearly 200,000 km2 area of the Pantanal region in the state of Mato Grosso.
The project, “Subdivision of the Pantanal area into geological and environmental counterparts,” funded by FAPESP as a regular research project, collected information pertaining to the period 2001-2012 using new methods and technologies and generated the largest amount of information ever amassed by remote sensing of the biome.
“How can we possibly make a management plan without knowing how each area works? It’s really important to learn about the various wetlands that make up the region,” said Teodoro Isnard Ribeiro de Almeida, professor in the Department of Sedimentary and Environmental Geology of the IGc/USP and coordinator of the research project.
According to Almeida, it was often thought that the Pantanal consisted of lowlands with ponds. Although this area is in fact lowland, it is a region of extensive environmental variability, and many regions suffer from intense drought year after year. This heterogeneous, complex and dynamic scenario was the target of the project, which sought to identify elements on which to base a system for organizing the Pantanal’s many facets.
“Our proposal took into consideration the vegetation as much as the physical means for doing this classification, in addition to presenting a broad methodological and reproducible description, which is one of science’s basic tenets,” said Almeida.
The rainfall in this region ranges between 800 and 1,600 millimeters per year. The rainfall that falls in the highest areas in the north and west is responsible for flooding and altering the landscape.
Other areas experience little rainfall, such as the Caatinga in western Pantanal, located near Corumbá in the state of Mato Grosso do Sul (MS). In other wetland areas, however, such as the region north of the city of Aquidauana (MS), thousands of freshwater lakes lie adjacent to brackish water. Between Corumbá (MS) and Cáceres in the state of Mato Gross (MT), there are more than 150 km of lakes and ponds on terrain that is practically devoid of human occupation.
Researchers have established several different divisions for the biome, ranging from six to 25 regions, making it difficult to use this area as a reference for scientific studies. “We often do not even know which researcher is using a particular sub-division,” said biologist Natasha Costa Penatti, who is writing her doctoral dissertation as part of the project.
Penatti explains that it is not unusual to have to use several maps, including maps of the soils, river basins, and geology, and overlay them in an attempt to find common characteristics among certain regions, which gives rise to considerable subjectivity when determining the boundaries of each division. “We would like to establish more objective criteria to group these areas”, she said.
The information is currently being analyzed. Part of this work will be performed using computer programs that can process large volumes of data, such as Self-Organizing Maps, with the help of software from Australia.
The group has presented its preliminary findings at international symposia and has recently submitted two articles for publication. An additional two papers are being written. Penatti’s doctoral dissertation, scheduled to be defended in November, will include a proposal for dividing the Pantanal on the basis of this research.
Accompanying the plant cycle
The group’s main criteria for differentiating the sub-regions is known as Land Surface Phenology, or LSP.
Phenology can be defined as the study of plant cycles (e.g., germination, seedling, vegetative growth, flowering, fertilization, formation of seeds and maturation) or the periodic events in a plant’s life in terms of how it is influenced by environmental variations.
“We realized that phenology would be a good parameter because plants basically respond to all the environmental elements we would like to observe: the type of soil, climate, physical medium and many others things,” said Penatti.
The LSP approach differs from in situ monitoring of the phases of specific plants, such as blooming or sprouting, in that it is based on observations at a global or regional scale of the phenology. LSP remote sensing data serve as basic biological indicators to detect the response of the terrestrial ecosystems to climate variations.
Phenological measurements record the periodic phenomena of plants, such as the period of growth, greening, and senescence of the vegetation, within a particular area. Satellite imagery is used to monitor vegetation growth over the course of a year. Although they do not coincide with traditional phenological events, measurements obtained by LSP are a dynamic indication of the ecosystem.
Almeida’s team used modern remote sensing technology because current satellites allow for data collection over shorter time periods, which is important when working in dynamic areas.
Prior to the late 1990s, NASA’s Landsat satellite provided an overview of images collected every 16 days. To cover the entire Pantanal with cloudless images, records needed to be compiled over a two-year period.
Today, the MODIS system, aboard two NASA satellites, produces daily images that are combined into a 16-day series to form mosaics (composite images) having the best pixels (points) from each captured image. This approach is particularly important in preventing the loss of data in areas that may be covered by clouds.
“In a dynamic region like the Pantanal, you get very different conditions for a single location over the course of a year, which makes it hard to assemble a mosaic of images,” said Penatti. She explained that previous technology limited the analysis of the results.
For this project, researchers used 276 of these mosaic images obtained by MODIS from 2001 to 2012. This involved 12 years of observation, each with 23 composite images.
Once acquired, the composite images are processed using software that not only sharpens the images but also generates graphs that allow phenological measurements to be extracted from the data regarding the modifications experienced by the vegetation throughout the year, such as the beginning or end of the growing season.
The program also provides information about the intensity of this process, and eleven different metrics are obtained to describe the vegetation growth. The data are then compared to other factors, such as rainfall, flooding, drought and the type of vegetation.
Information regarding rainfall patterns was provided by the Tropical Rainfall Measuring Mission (TRMM), variations in the total water storage were captured by the Gravity Recovery and Climate Experiment (GRACE), and monthly evapotranspiration data were obtained by the MODIS (product MOD16A2) system. The three satellites are from NASA.
Neotectonics – the observation and study of current tectonic movements – were also studied in this project. The Pantanal is a tectonically active region, where recent earthquakes have registered 4 on the Richter scale. This region was formed as a result of pressure between the South American plate, on which includes Brazil, and the Nazca plate, located under the Andes mountain range. The movement of these two plates has caused the region to descend, thus forming the Pantanal nearly 2.5 million years ago.
‘One giant sandbox’
This study was complemented by soil samples collected in two 15-day campaigns in two separate years. These surveys included 218 georeferenced samples collected at points of interest mapped by remote sensing.
The material was subjected to granulometry and fertility analyses. This survey, which covered more than 4,000 km, also served to verify the spectral record of the satellite images by directly correlating the granulometry with the spectral imagery.
Granulometry, or the size of the grains of soil, is one of the key elements in understanding the dynamics of the Pantanal vegetation, the professor explained. The enormous depression that began to form nearly 2.5 million years ago has now been filled with mainly sandy sediment.
Although a large portion of the Pantanal is flooded every year, similar to an enormous sandbox, a large part of the region cannot hold water for long dry periods because the sediment and soil that cover it are porous and permeable.
There are also clay regions that stay damp for longer periods because their soil has low permeability. At the same time, some areas with sandy soil remain damp after floods, whereas adjacent areas with a similar soil dry completely. In this case, the ability to dry out or retain water is explained by only slight differences in the soil, some of which are due to recent tectonic movements.
The Agency FAPESP licenses news via Creative Commons (CC-BY-NC-ND) so that they can be republished free of charge and in a simple way by other digital or printed vehicles. Agência FAPESP must be credited as the source of the content being republished and the name of the reporter (if any) must be attributed. Using the HMTL button below allows compliance with these rules, detailed in Digital Republishing Policy FAPESP.
