


Conducted by an international group that included Brazilian scientists, the project created charts that show how the brain grows rapidly in early life and shrinks as we age. The researchers hope the charts will one day be used in clinical practice (photo: Eduardo Cesar/Pesquisa FAPESP)
Conducted by an international group that included Brazilian scientists, the project created charts that show how the brain grows rapidly in early life and shrinks as we age. The researchers hope the charts will one day be used in clinical practice.
Conducted by an international group that included Brazilian scientists, the project created charts that show how the brain grows rapidly in early life and shrinks as we age. The researchers hope the charts will one day be used in clinical practice.
Conducted by an international group that included Brazilian scientists, the project created charts that show how the brain grows rapidly in early life and shrinks as we age. The researchers hope the charts will one day be used in clinical practice (photo: Eduardo Cesar/Pesquisa FAPESP)
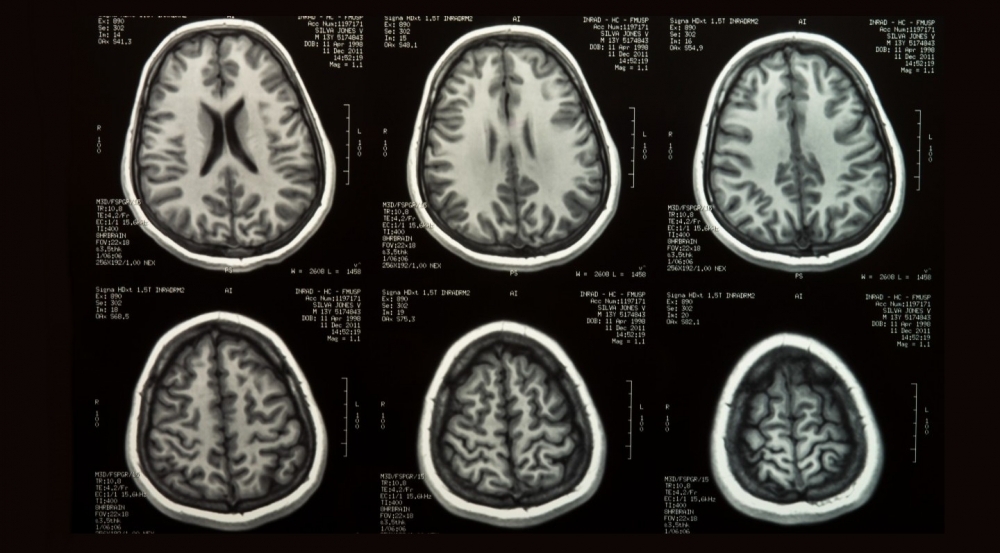
By Luciana Constantino | Agência FAPESP – An international group of scientists, including Brazilians, analyzed 123,984 magnetic resonance imaging (MRI) scans to map the development of the human brain from the first weeks of the fetus to 100 years of age. They produced brain charts that show age-related changes from rapid growth during gestation and infancy to maturation in the first few decades and senescence from about the sixth decade.
This systematization of typical and atypical brain development processes is designed to serve as a benchmark, analogously to the growth charts long used by pediatricians to monitor the height and weight of children in the first decade after birth. The charts will be used by researchers and should also have future clinical applications.
The study was led by scientists at the University of Cambridge in the United Kingdom and the University of Pennsylvania in the United States. An article reporting their findings is published in Nature.
The charts provide a basis for age- and gender-based metrics, permitting comparisons and pointing to ways of identifying disorders that appear at different stages of life, for example, as well as brain changes potentially signaling progressive neurodegenerative diseases such as Alzheimer’s and Parkinson’s.
The dataset is considered the largest and most inclusive available, deriving from MRI scans of the brains of 101,457 people from many different countries. Although individuals with European and North American ancestry predominated, it included data for individuals from South America, Africa and Australia. Nevertheless, the authors note, this range is narrow in the context of global diversity, and they promise to continue adding data via the web-based interactive tools at BrainChart.
“The main methodological difference of our study is that it provides a robust set of reference standards that have never been made available before. Patients’ scans can now be analyzed to understand how their brains are developing compared with these charts and percentiles. Small variations can be investigated more effectively in the context of such a large dataset based on so many samples,” Pedro Pan, a professor in the Psychiatry Department of the Federal University of São Paulo’s Medical School (EPM-UNIFESP) and a co-author of the article, told Agência FAPESP.
Pan is deputy principal investigator for the Brazilian High-Risk Cohort Study of Childhood Psychiatric Disorders (BHRC), a large community-based survey involving 2,511 families living in the Brazilian cities of Porto Alegre and São Paulo, with children aged 6-10 when it began in 2010. It is considered one of the largest mental health surveys conducted in Brazil.
The BHRC is led by the National Institute of Developmental Psychiatry (INPD), which is supported by FAPESP and by the Brazilian government via its National Council for Scientific and Technological Development (CNPq). More than 80 university professors and researchers affiliated with 22 institutions are involved with INPD. Its principal investigator is Eurípedes Constantino Miguel Filho, head of the Psychiatry Department at the University of São Paulo’s Medical School (FM-USP).
INPD has collected more than 2,000 brain images in the past ten years. Some of them contributed to the study reported in the Nature article, whose co-authors include Giovanni Abrahão Salum, a professor at the Federal University of Rio Grande do Sul (UFRGS), and Andrea Parolin Jackowski and André Zugman, both of whom are professors at EPM-UNIFESP.
Findings
The researchers quantified MRI metrics by calculating scores for non-linear trajectories of brain structure changes and rates of change over the lifespan, using standardized neuroimaging software to extract data from the scans, starting with gray matter (synapses, neurons and other cells) and white matter (nerve fibers), and moving on to measure cortical thickness and the volume of specific brain regions.
They created the brain charts using generalized additive models for location, scale and shape (GAMLSS), a framework for modeling child growth charts recommended by the World Health Organization (WHO). With this approach, they were able to take advantage of the massive amount of neuroimaging data assembled, estimating age- and sex-related trends over the entire lifespan, defining developmental milestones (or peaks), and comparing their results with the findings in the literature.
They were thereby able to confirm, and in some cases even show for the first time, milestones that had only been posited hypothetically, such as the age at which the main types of cerebral tissue reach maximum volume, or when specific brain regions reach maturity.
For instance, they found that gray matter volume increases rapidly from mid-gestation onward, peaking shortly before the child reaches the age of six. It then slowly decreases. Gray matter volume in the subcortical region, which plays important roles in cognitive, affective and social functions, peaks in adolescence, around age 14.
White matter volume grows rapidly from mid-pregnancy to early childhood, peaking around age 29 and decreasing fairly quickly from age 50 onward. “This shows that the plasticity of these connections lasts until the onset of adulthood,” Pan said.
Cerebrospinal fluid was found to increase until age 2, followed by a plateau until age 30 and then a slow linear increase that becomes exponential in the sixth decade of life, implying a decrease in brain volume.
“This marker is used in clinical medicine as indirect evidence of cerebral aging, which may be associated with neurodegenerative disorders. We now have some of these benchmarks for the brain with far greater accuracy and precision,” Pan said.
Scientists have long known that cerebrospinal fluid volume increases with age and is typically associated with cerebral atrophy, but only such a massive dataset could provide clear evidence of the speed with which the process advances.
Cooperation
In contrast with the trend in genetics, where millions of datasets are routinely analyzed, studies in the field of neuroscience usually involve relatively small samples. This is partly due to the difficulty of collecting images, not least because MRI equipment is very expensive.
An article published in Nature last March discussed the topic, noting that many neuroimaging studies fail to produce valid results because their small sample sizes cannot lead to reliable findings.
“The solution is to work with large and diverse samples, just as this international group has set out to do,” Pan said, who in December 2020 discussed cooperation with Richard Bethlehem (Cambridge) and Jakob Seidlitz (Pennsylvania), first authors of the article on lifespan-brain development charts in the April issue of Nature.
To create a globally representative sample, the scientists aggregated MRI scans from more than 100 studies conducted in several countries. According to an editorial on authorship of open data in the same issue of Nature, “Not all the data sets were originally available for the researchers to use”. The editorial notes that research funders all over the world support the “FAIR principles (which ensure data are findable, accessible, interoperable and reusable)”.
Interviewed for a story posted to the University of Cambridge’s website (cam.ac.uk), Bethlehem stressed the importance of cooperation and open data. “What we have been able to do through a very coordinated global effort is to stitch together data across the lifespan. This allows us to measure the very early, rapid changes that occur in the brain and the long, slow decline as we age,” he said.
The article “Brain charts for the human lifespan” is at: www.nature.com/articles/s41586-022-04554-y.
The Agency FAPESP licenses news via Creative Commons (CC-BY-NC-ND) so that they can be republished free of charge and in a simple way by other digital or printed vehicles. Agência FAPESP must be credited as the source of the content being republished and the name of the reporter (if any) must be attributed. Using the HMTL button below allows compliance with these rules, detailed in Digital Republishing Policy FAPESP.
