


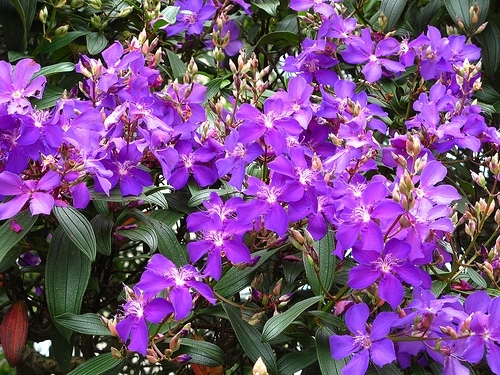
Innovative, artificial intelligence-based methodology detects occurrences of Pleroma by identifying blooms, and maps distribution in biome (photo: Wikimedia Commons)
Innovative, artificial intelligence-based methodology detects occurrences of Pleroma by identifying blooms, and maps distribution in biome.
Innovative, artificial intelligence-based methodology detects occurrences of Pleroma by identifying blooms, and maps distribution in biome.
Innovative, artificial intelligence-based methodology detects occurrences of Pleroma by identifying blooms, and maps distribution in biome (photo: Wikimedia Commons)
By Karina Ninni | Agência FAPESP – Biologist Fabien Hubert Wagner determined the occurrence and distribution of tibouchina trees (Pleroma spp., also known as purple glory) throughout the Atlantic Rainforest biome using free satellite images and deep learning, a form of artificial intelligence (AI).
Patches of purple and magenta flowers were clearly visible in the images, which were available free of charge for the period from June 2016 to July 2020. The trees were identified and distinguished from other species by AI neural network software.
According to Wagner, a researcher at the Foundation for Science, Technology and Space Applications (FUNCATE) in São José dos Campos, Brazil, mapping the spatial distribution of a plant is a challenging task in ecology, and this is the first time AI has been used for this purpose in Brazil. The conventional method is statistical and uses climate and rainfall data, among others.
“The method we used is novel. Only two or three people are currently publishing in the field. Studies have been done in Panama and Costa Rica, but they involved small forests,” he said. “Here in Brazil, I developed the method in 2018 to map the distribution of Pleroma mutabile and P. pulchra in the first study using very high-resolution imagery. This latest study involving P. granulosa used medium-resolution imagery, in which 1 pixel corresponds to 10 square meters. I was able to identify groups of trees of the same species. Luckily, Pleroma occurs in stands. It’s a very common tree and well-known for its brightly colored blooms.”
Wagner processed 33,798 Sentinel-2 satellite images to detect and map the occurrences. An article on his findings is published in Scientific Reports.
“In their entirety, the images cover the requisite area,” he explained. “There are two aspects to consider: time, since the images are captured every five days; and space, since free images are available for a specific area. This is important: higher-resolution images are expensive, whereas the data on which the article is based can be downloaded by anyone.”
The study was supported by FAPESP via a Young Investigator grant and YI scholarship awarded to Wagner.
Deep learning
Wagner recalled that he trained the neural network to recognize the flowers of P. granulosa and those of similar species such as the Pink trumpet tree (Handroanthus impetiginosus), for example. “Handroanthus has flowers of roughly the same color, but Pleroma trees can be identified in the images because they always occur in stands. They’re small, and you can’t make out individuals, whereas Handroanthus trees are tall and primarily seen in ones or twos in shady forest,” he said.
After detection by the algorithm, the human eye can distinguish between the two genera during analysis of the results.
He chose deep learning because it works faster and more consistently than humans. “Traditional machine learning techniques consider just one pixel. Deep learning considers each pixel and its neighbors, taking the context into account, so the results contain more information. It can distinguish what is from what isn’t information of interest to the research. It’s more powerful because it can perform human tasks, tasks we perform with our eyesight,” he said.
To train the model, he used more than 100,000 images as samples. “They were very small, mere cutouts corresponding to just over 1 square kilometer. From previous research involving the same region, Serra do Mar, I already had images mapped and knew where to look for the samples,” he said.
The method he developed could be used to detect occurrences of other species with colorful flowers. “It would also be possible to map trees with yellow flowers. I didn’t choose yellow because it’s a little harder to observe in the forest, which is a sea of green. But it can be done,” he said.
Blooming
The analysis showed that trees with purple, pink or magenta flowers occurred in 13.2% of the pixels for the Atlantic Rainforest domain (139,960 pixels). Most were Pleroma, with a smaller proportion corresponding to Handroanthus.
According to Wagner, Pleroma trees bloom at different times in different parts of the biome, making analysis somewhat harder. “I expected just one blooming, all perfect. It’s very interesting because there were several blooming patterns and I hadn’t foreseen that,” he said.
He started with the aim of studying the correlations between blooming and rainfall or climate change. “If all the trees bloomed at more or less the same time in environments with different climates, I would be able to find out more about the biology of the genus, but that wasn’t the case because of the considerable diversity. There are other interesting things to investigate, but the correlations between blooming and climate will have to wait,” he said.
Biologists refer to Pleroma trees as pioneer species, meaning they are among the first to re-emerge after deforestation. “They tend to spread in degraded areas,” Wagner explained. “The fact that they were detected in certain places may mean these are areas that are recovering. I’d already observed this phenomenon in a project with colleagues using high-resolution imagery. We had aerial photographs of Serra do Mar from the 1960s, where we could see that these trees occurred mostly in areas of pasture.”
Mountain ranges and plateaus
Pleroma trees occur mostly in highlands and mountain ranges, Wagner explained. “The pattern we detected appears to reflect elevations near the Atlantic coast, particularly mountain ranges known as serras: 26.6% of the occurrences were in the five main serras,” he said. The highest proportions were in Serra do Mar (9.3%) and Serra da Mantiqueira (Caparaó 7.5%, Itatiaia 6.6%), followed by Serras do Leste Catarinense (1.2%), Serras do Quadrilátero Ferrífero (1.1%) and Serras do Espinhaço Meridional (1%). Moreover, 17.9% were on upland plateaus near serras, such as Planalto de Paranapiacaba (6.2%), Planalto dos Campos das Vertentes (5.7%), Planalto do Alto Rio Grande (3%) and Planalto de Poços de Caldas (3%).
Sites with high detection densities in excess of 100 kilometers were observed north of Curitiba, Paraná state, and south of São Paulo city in Serra do Mar and Planalto de Paranapiacaba.
Next steps will include differentiating species per square kilometer. “Species are mixed in the same square kilometer, with different blooming seasons, and in this case, we need to distinguish individual trees, which has to be done pixel by pixel. It’s feasible, but laborious and time-consuming. I plan to embark on this task in due course,” Wagner said.
The article “The flowering of Atlantic Forest Pleroma trees” is at: www.nature.com/articles/s41598-021-99304-x.
The Agency FAPESP licenses news via Creative Commons (CC-BY-NC-ND) so that they can be republished free of charge and in a simple way by other digital or printed vehicles. Agência FAPESP must be credited as the source of the content being republished and the name of the reporter (if any) must be attributed. Using the HMTL button below allows compliance with these rules, detailed in Digital Republishing Policy FAPESP.
